

Simulating Performance of Extended-Reach SAGD wells – part 5
In this week’s Wellbore Wednesdays we’re taking a look at an extended-reach SAGD producer well with packers in the liner and a ported tailpipe. Last time we looked at the same well but with a ported tailpipe and no packers. If you’d like to catch up, the previous article is here:
Simulating Performance of Extended-Reach SAGD wells – part 4
Last time, we had five ports and an open tailpipe. This time, with the 1400 m long tailpipe, we decided to go with packers every 100 m and one port in each packed section. This gave 14 ports, evenly spaced along the liner and the tailpipe end is closed in this case. We’re not doing anything clever with inflow, it’s evenly distributed along the liner, all the other conditions are the same as the previous models.
We’re going to contrast these results with the no-packer liner from last time, because there’s some interesting things with liner and tailpipe pressures. Here’s the no-packer liner results:
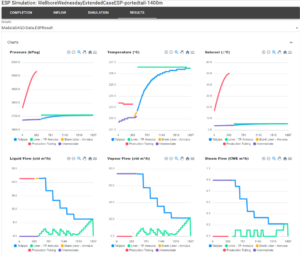
Here’s the results with packers:
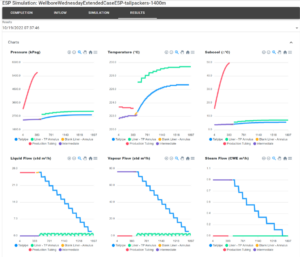
Looking at the bottom three plots of each, the flowrate at the heel is the same, and on the lower plot with packers we see that each device is flowing a lot less (they’re a lot smaller) and the flows are very evenly-distributed. If you look at the top three plots of each, you’ll see that the pressure and temperature profiles are a bit different. This is worth looking at more closely. Here’s the pressure plots side-by-side:
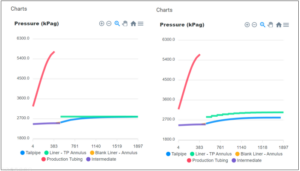
Without packers is on the left, with packers is on the right. The riser tubing in red and casing annulus in purple are the same and the tailpipe profile is also the same. The liner annulus in green is different and there’s a straightforward but important explanation. On the left, without packers, the liner balances by splitting flows left and right to each port. The liner isn’t carrying the full well rate at any given point. In that case we had staggered port sizes, the smallest at the heel and the largest towards the toe, because the tailpipe loses pressure as it approaches the heel and we have evenly-distributed inflow. The higher dP to the liner at the heel end means you need a smaller device for the same flowrate. In the packed liner, we have 14 ports all the same size. With packers, the pressures in each section are independent. With evenly-distributed inflow and the same flow per port, we have the same dP from the liner to the tailpipe all the way along, about 250 kPa. That means the liner pressure trend follows the tailpipe. To generate an even liner profile with packers, we would have to use staggered device sizes again, smaller towards the heel and larger towards the toe. A lot of the performance is driven by the tailpipe hydraulics which is something to keep in mind when designing wells like this. Also, build a good relationship with your FCD vendors, there’s more sophisticated ways to control flow than just ports.
Packers provide more flexibility by isolating liner sections from each other, which is useful if you have highly-variable conformance. They’re straightforward to design with our software though, these simulations only take 15 – 20 seconds to run.
Next time we’ll summarize where we’ve got to so far and then we’ll start looking at non-uniform inflows and the impact on each completion type we’ve looked at. Until then, thanks for reading and please reach out to Stan Cena, Raj Bal or Damien Hocking if you’d like to learn more.